Financial Modeling Your Advertising Results
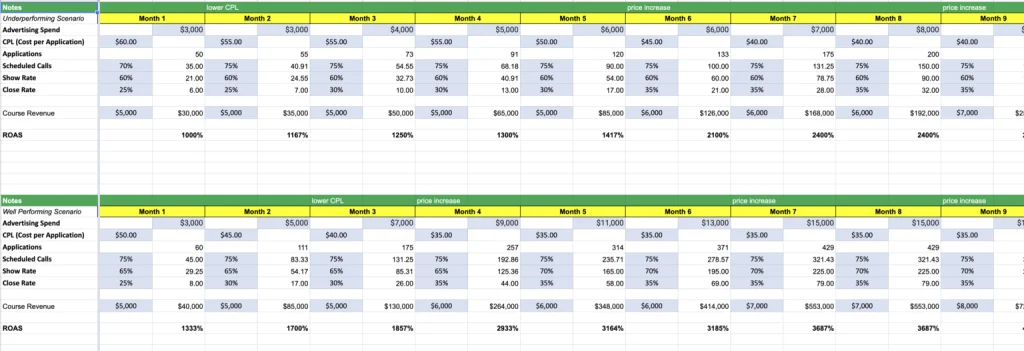
One opportunity we see with all our clients in the education space is they are not leveraging the power of modeling out financial projections, especially for their advertising. These projections help you visualize what you need to do to get the desired number of students in your cohorts. Plus it’s exciting to see the revenue potential. At the end of this blog, I’ll share the link to a real model you can play with.
I’ll walk you through here on how we help our clients model projections on how many students they could get with paid advertising. You’ll want to model this out. We’ll model a few different scenarios and the main underlying variables in an advertising financial projection are:
- Total advertising budget
- Cost per application
- Number of scheduled calls
- Show up rate to these scheduled calls
- Closing rate (sales team)
- ROAs (return on ad spend)
Total Advertising Budget
We recommend clients be ready for at the minimum $100 a day in advertising budget because the machine learning in the ad platforms favors that minimum and will give you better traffic and costs.
There’s two ways to scale your paid advertising (profitability). The normal route is after we get to a point of seeing how much it costs to get a new student enrolled. This typically is a slower route to filling up students in your class because you need to go through one or two full cycle of enrollments to get that ultimate figure that you’re happy with.
The alternate way to scale your paid advertising is halfway through the cycle. Typically that halfway cycle is at a cost per showed up calls you’re happy with and have a healthy amount of calls with prospective students and confident a healthy amount of prospective students in the pipeline will enroll. If you want to get even more aggressive the earliest point we advise you to scale your ad budget is at a healthy cost per call.
Through a financial model like ours you can model each month to visualize which months might be the best months to start scaling your ad budget to get more enrollments.
Cost Per Lead
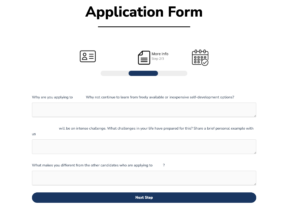
A high converting funnel we deploy for clients typically has a form where we collect leads’ contact details and ask a few qualifying questions to vet if they’ll be a good fit. This CPL metric calculates how much it costs to get his form filled out.

Scheduled Calls
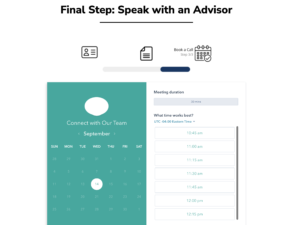
After a lead fills out this form they are asked to schedule a zoom meeting with admissions/sales. Naturally not everyone who fills out the form will schedule a call. This is good because you filter out less qualified leads.
Show Up Rate
Naturally out of everyone who schedules a call not everyone will show up for the meeting. There are a variety of reasons someone may have not shown up for the meeting such as they genuinely had a schedule conflict, forgot, already signed up with a competitor, or it’s possible they lost interest. There are many ways to re-engage to enroll these missed appointments, feel free to shoot me an email if you’re curious how tom@atomicenrollment.com.
Closing Rate
This means for every lead you connected with how many ended up enrolling.
ROAs
This means what is your return on advertising spend. The formula is total revenue generated from ad leads/total advertising spend. So for every dollar of ads you spend how many dollars in revenue did you get back.
Now there are variations of other funnel and campaign types we’d deploy for a client but this financial model gets pretty close to what happens in reality.
The beauty of us being able to work on projections for clients is we can support the model with real assumptions we see across the industry in real time. These are the range of averages for each input for a $10,000 program (the average our client’s program prices) we see right now, keep in mind typical the higher the price point of your program the higher your costs:
- Cost Per Application
- $25 = Amazing
- $50 = Average
- $100 = Bad
- Scheduled Calls
- 80% = Amazing
- 60% = Average
- 30% = Bad
- Show Up Rate
- 80% = Amazing
- 60% = Average
- 30% = Bad
- Closing Rate
- 40% = Amazing
- 20% = Average
- 5% = Bad
- Keep in mind you might think your current sales team is great because they are “closing” 40% but if you have a small class and or only leads they are closing is from referrals that is not a good rate. Our 40% “amazing” closing rate is enrolling students who have never heard of you prior to the ad they saw.
Here’s a real model you can play with, feel free to just make a copy: https://docs.google.com/spreadsheets/d/1wQ1I-4YjlkyZC_IpUFwwbkkkYP51iZ2K9H_bMk3QD6Y/edit?usp=sharing

